

7 myths about the histogram
Monday 12 April 2021, 22:33 by Nando Harmsen | 12,142 views | 6 commentsThis article was translated from Dutch with the help of AI. Read the original.
The histogram is an important part of assessing exposure. You look at it and use it to decide whether your photo is correctly exposed.
Or so they say. But that is not necessarily true. I have listed this and six other myths about the histogram.
A histogram is a useful tool for modern photography. It tells you a lot about the photo, and you can use it for your exposure. But people also often see information in it that is not there.
Before I list the seven myths about the histogram, I will first explain what a histogram is.
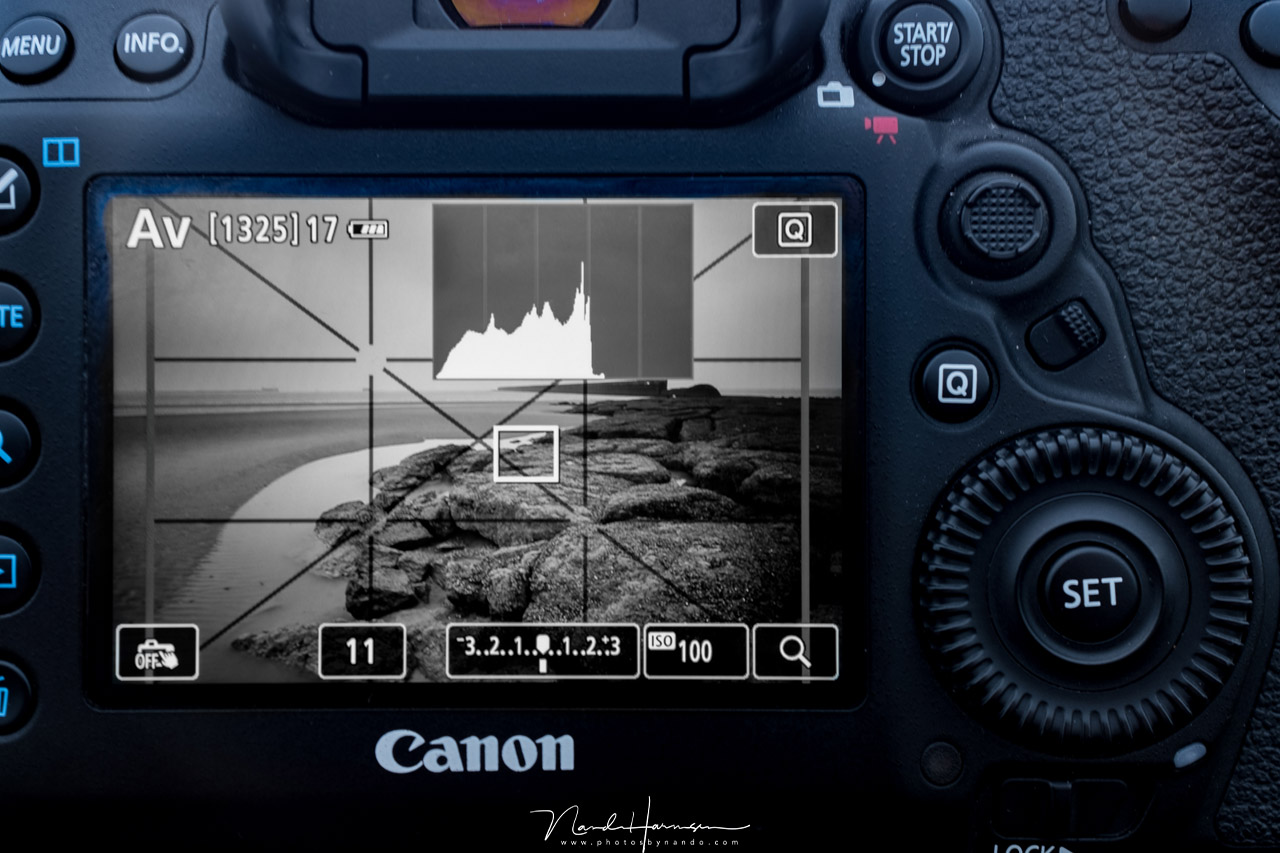
What is the histogram?
A photo consists of pixels, and they all have a certain brightness. Temporarily convert your photo to black and white and you will see those brightness levels as shades of grey. Pure black is on the left and pure white is on the right. There are 254 shades of grey between them.
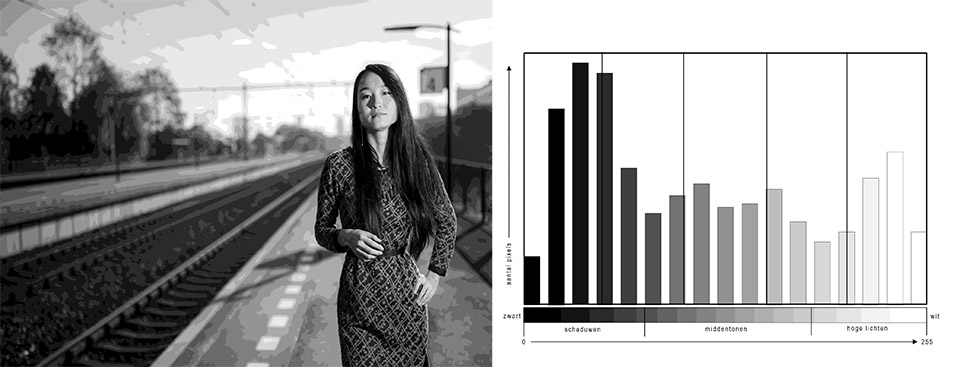
The histogram shows how many pixels there are of each of those 256 shades of grey, 254 shades of grey plus black and white. That determines the height of the peak at that position. In other words, the histogram consists of 256 peaks, one for each shade of grey, including black and white.
It may become clearer if you reduce the number of brightness levels in a photo to 17 shades of grey. You will then see the individual peaks very clearly.
1. If the histogram is good, the exposure is always correct
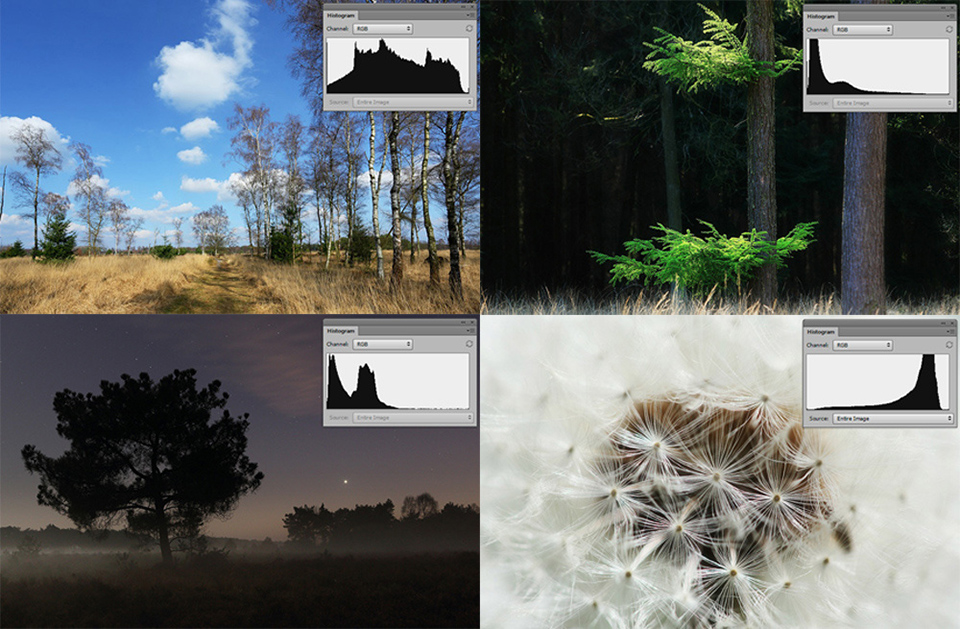
A histogram says nothing about whether an exposure is good. It only tells you how many pixels there are at each brightness level. If you take a photo of a white wall with someone in front of it, there will be many light pixels. If you photograph a night landscape, you will have many dark pixels instead.
In the first case, the histogram will show many peaks on the right, where the light pixels and white are. In the second case, many peaks will be visible on the left, where the dark pixels are.
The correct histogram therefore depends on what you have photographed. You should always view the histogram together with the photo before you can decide whether the exposure is good. One cannot do without the other.
2. You should aim for the ideal histogram
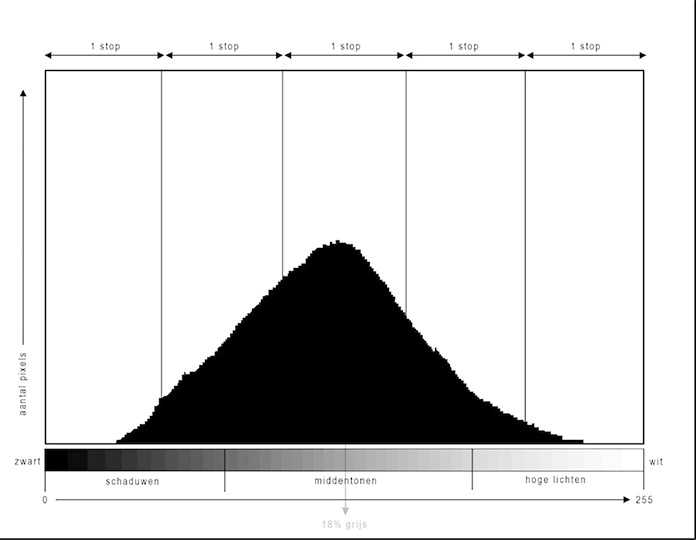
The classic example of a histogram is the so-called curve with a Gaussian distribution. The peak is highest in the middle, and it curves down towards both sides. This is often called the ideal histogram.
If you look more closely at this Gaussian distribution, it means that there are mainly midtones. This gradually decreases as the brightness levels move towards white and black. The photo with this histogram therefore has no white or black and very few dark or light brightness levels.
This ideal histogram is therefore nothing more than a representation of a photo with average to low contrast. It is simply a representation of one of the many shapes a histogram can take.
3. There is more information on the right than on the left
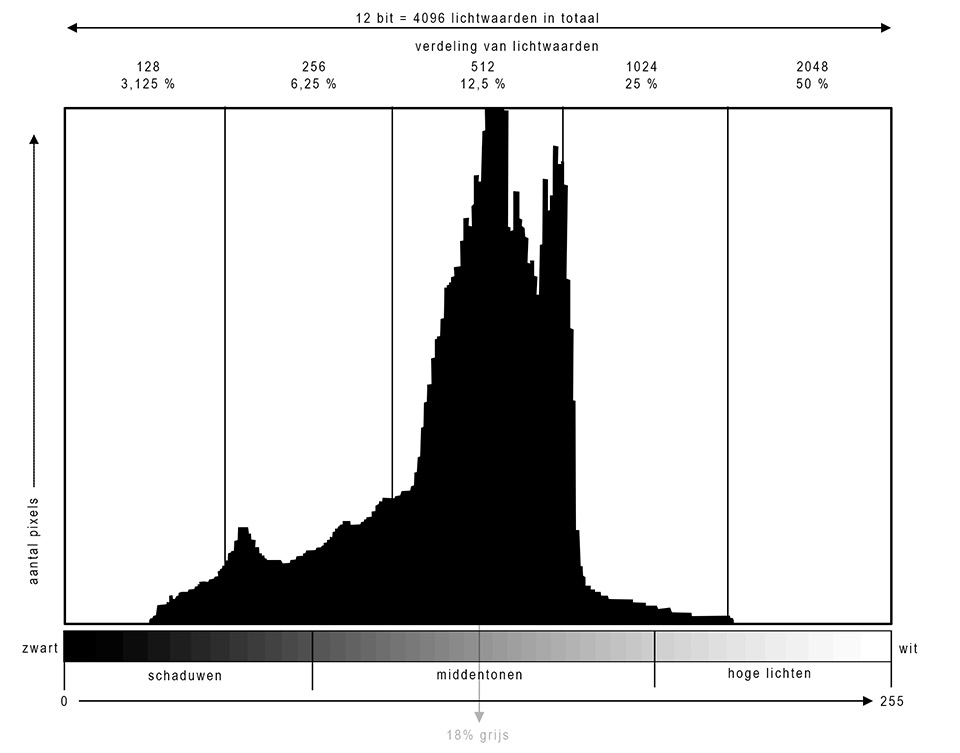
You sometimes see a histogram showing that the lightest section contains 2048 brightness levels. One stop darker would then contain 1024 brightness levels. This continues towards the darkest section of the histogram, where there are only 32 brightness levels left.
This is impossible, for the simple reason that the histogram is only a scale of 256 brightness levels. It is a linear scale, as it is called. If the histogram contained more brightness levels per section, it would have a logarithmic scale.
The only thing the histogram tells us is the distribution of the number of pixels across 256 brightness levels. Nothing more and nothing less.
4. I use the histogram of the raw photo
A RAW file consists of nothing more than raw data from the sensor. It is not yet a photo. It first needs to be processed into a viewable image before we can see it. That is why every raw file contains a small JPEG preview, which is shown when we view the raw file.
A raw file therefore has no histogram. What we see is a representation of the built-in small JPEG preview, with no more than 256 brightness levels. The raw file contains many more brightness levels than you see in the histogram of the JPEG preview.
5. The brightness levels should be distributed across the histogram as evenly as possible
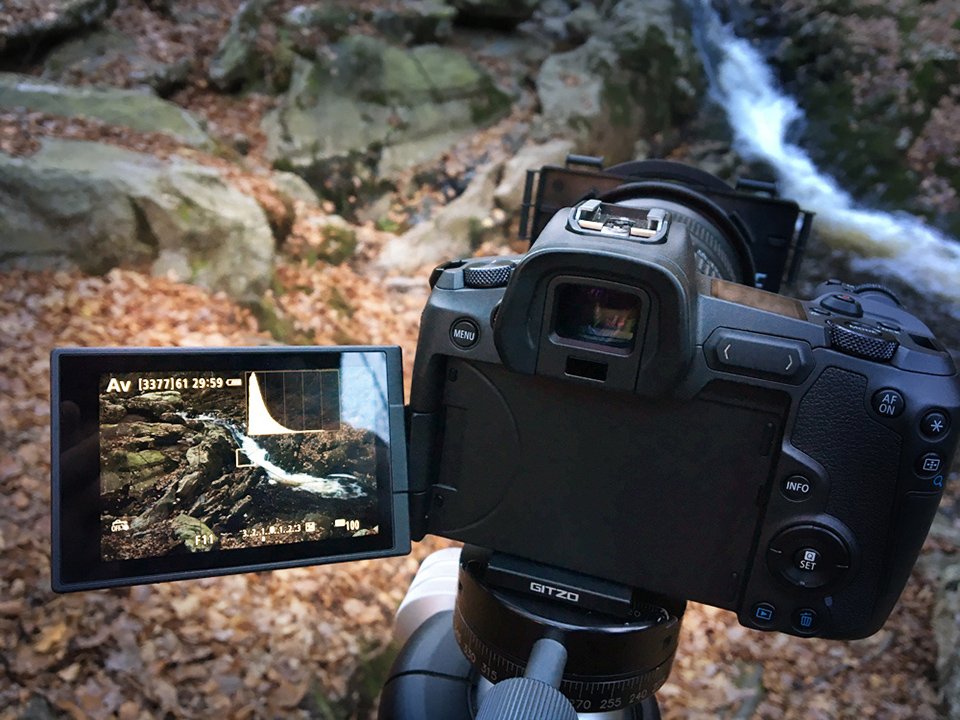
The pixels in a photo do not have to be distributed across the whole histogram. You can do this to achieve maximum contrast, but not every photo needs maximum contrast.
Think of a photo that is mostly white. It may not contain any black at all, so it makes no sense to force black back into it by distributing the pixels across the entire histogram.
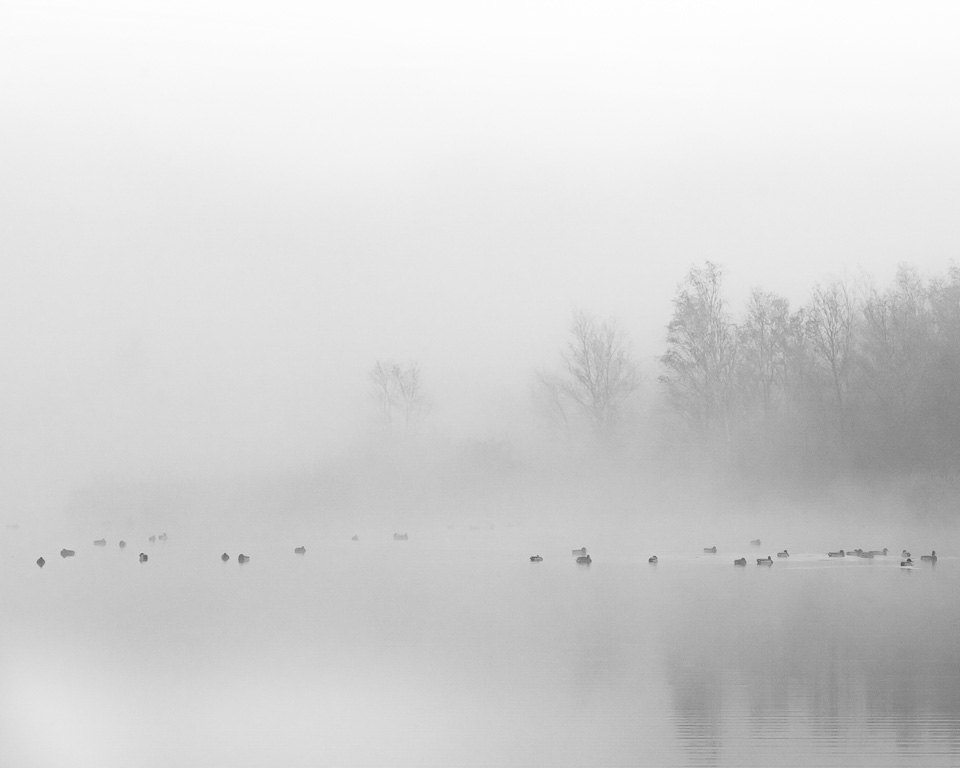
A photo taken in mist may not contain any white or black at all. You can add black and white by maximising the contrast, but then it is no longer a misty photo.
6. You cannot get a good exposure without a histogram
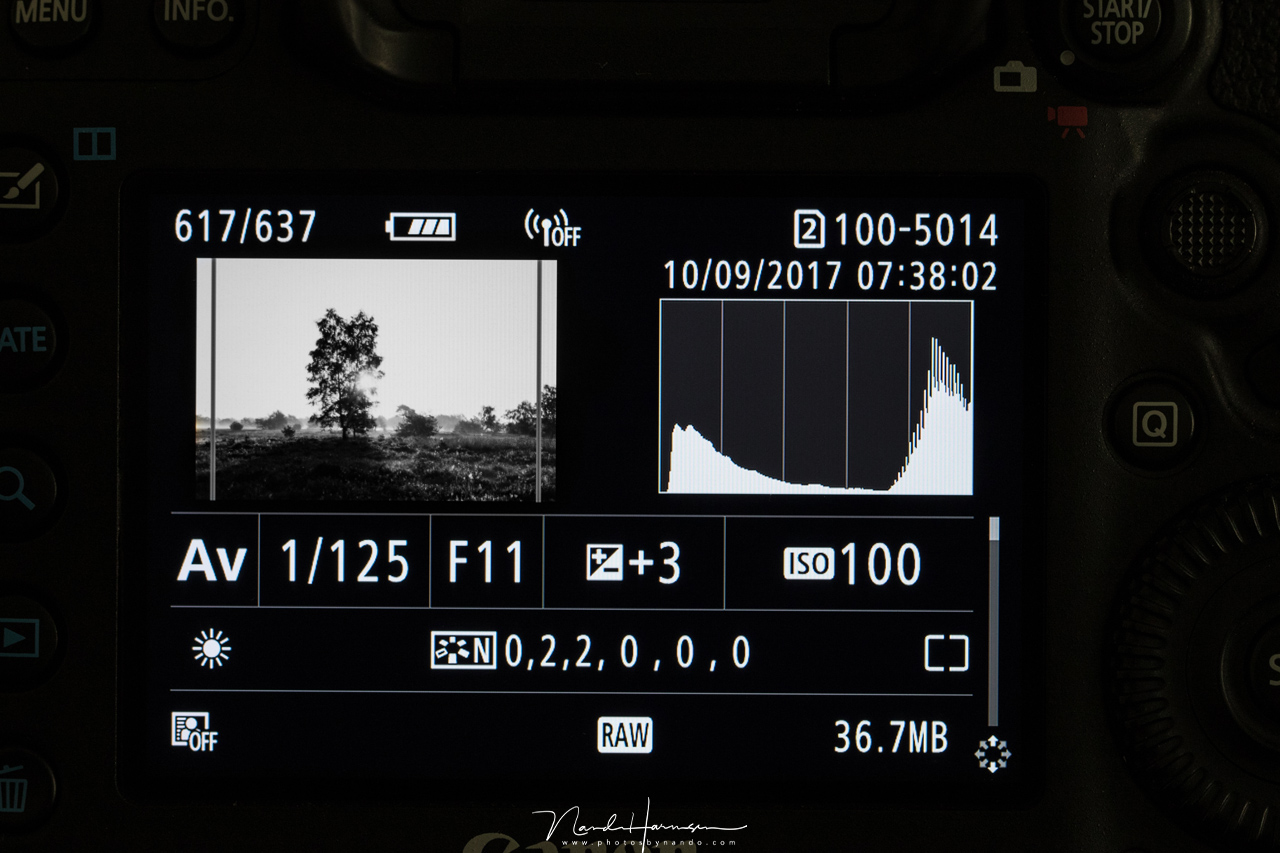
A histogram is not necessary for a good exposure. If you do not look at the histogram at all, you can simply use the preview on the screen to decide whether your exposure is good.
After all, the histogram is only a representation of the distribution of pixels across the 256 brightness levels in your photo.
That does not mean that the histogram is not useful. It can help you set the exposure as accurately as possible. But it is certainly not essential to keep an eye on the histogram at all times.
7. You cannot change the shape of the histogram
The shape of the histogram refers to the distribution of brightness levels in the photo. And indeed, you cannot change that while taking the photo. But you can do so in post-processing.
In post-processing, you can make dark areas lighter and light areas darker. When you do this, the distribution of brightness levels in the photo changes. And so does the histogram. After all, the histogram is only a representation of the brightness levels in the photo on your screen.
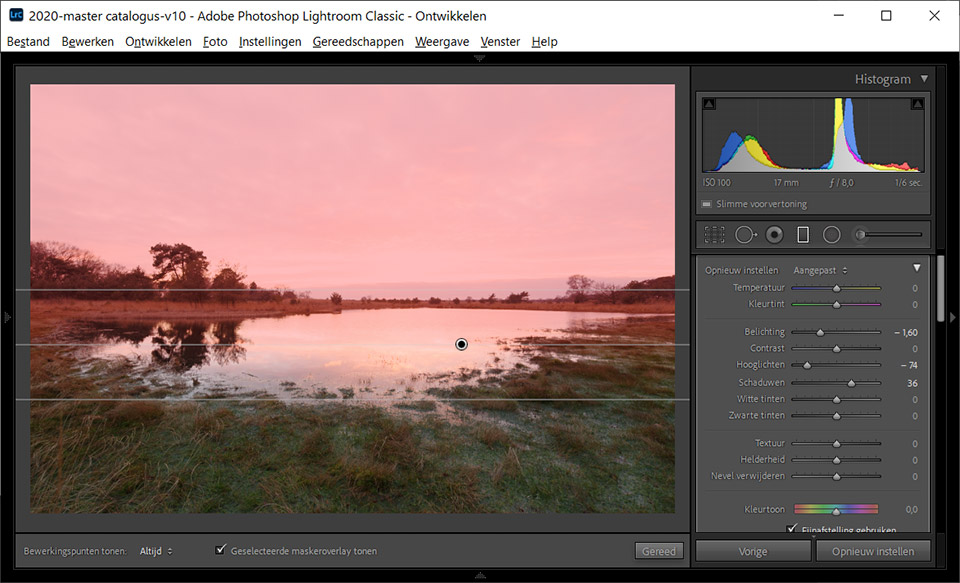
You can therefore change its shape drastically. This works best if you have photographed in raw, of course, because this file contains more brightness levels than your monitor can display. That gives you the freedom to adjust the distribution of brightness levels as you wish.
The histogram is a tool, not a miracle cure
No matter how much people insist that you should use the histogram in your photography and post-processing, always remember that it is a tool. It is not the answer to everything concerning a good exposure. In other words, it does not perform miracles.
What a histogram tells us is the distribution of brightness levels in a photo. You can use this to adjust the exposure if necessary.
Also check out my Advanced Exposure course
Do you want to know everything about exposure? Then check out the Advanced Exposure course on Photofacts Academy. In it, I tell you everything you need to know for a perfectly exposed photo.
About the author
Nando Harmsen has been photographing for more than 40 years. He specialises in wedding photography and landscape photography. Nando also gives talks, workshops, masterclasses and photo trips, and regularly reviews new and interesting equipment.
You might also like
-
 A Histogram Says Nothing Without a Photo
by Nando Harmsen
-
 7 tips for property photography
by Elja Trum
-
 How necessary is a flash meter?
by Elja Trum
-
 Smarter exposure when photographing in snow
by Nando Harmsen
-
 Persistent Myths in Photography
by Nando Harmsen
6 comments
-

 Donald Willemsen
wrote on Tuesday 13 April 2021 at 11:00
| reply
Donald Willemsen
wrote on Tuesday 13 April 2021 at 11:00
| reply
Nando, thank you for your explanation and vision. To answer your question, the following: During photography I do not use the histogram. I mainly pay attention to the combination of shutter speed and aperture. I also take the focal length being used into account. If the contrast between light and dark is high, I meter the light areas and the dark areas separately and then determine an average for the exposure. The DoF is the determining factor for my choice of aperture and the shutter speed then follows from that.
Translated from Dutch.
During post-processing I do look at the histogram and adjust if necessary. -
 PixelDude Raoul
wrote on Tuesday 13 April 2021 at 11:46
| reply
PixelDude Raoul
wrote on Tuesday 13 April 2021 at 11:46
| reply
Good to hear this opinion for once. After all, I have never understood why some people insisted so strongly on using the histogram. What matters to me is not getting any extremes in my photos, no blown-out whites and also no black without any information or too much noise in the dark areas. By the way, I can set my cameras so that overexposed areas light up orange and underexposed areas blue. If I have both at the same time, I know I had better switch to HDR. I also always try to photograph with high (not over) exposure, but that in turn has to do with avoiding noise.
Translated from Dutch. -

-
 Rein wrote on Tuesday 13 April 2021 at 14:21 | reply
It is indeed important to have information at the extremes. You can see that in the histogram. There is no more information on the left than on the right, but by having the peaks of the histogram on the right without overexposure, you can shift light towards the dark parts in post-processing. That is better than shifting the dark parts to the right. 'Expose to the right'.
Translated from Dutch. -
 jerry wrote on Tuesday 13 April 2021 at 21:24
| reply
jerry wrote on Tuesday 13 April 2021 at 21:24
| reply
Many thanks for the clear explanation.
Translated from Dutch.
I use the histogram to check that I don't have any clipping -
PixelDude Raoul
wrote on Wednesday 14 April 2021 at 09:14
| reply
My impression of the histogram.
Translated from Dutch.
In the analogue era, there was no photographic histogram. When digital photography was introduced, after some time a camera brand managed to produce a histogram. Perhaps to position itself as ‘all-powerful’ compared to the competition, a great deal of importance was attached to the histogram, farrrrr too much. Several photographers who wanted to make themselves known as the ‘better’ ones went along with this story. And so, after a while, the histogram was even included as an important tool in educational programmes. But what does it tell you? Actually nothing other than where the colours and contrasts are located. For people who like dark photography, the histograms will mainly have a leftward bias, and for lovers of very light photography, the histogram will mainly be situated on the right. A histogram shows more of the photographer’s feeling than it provides useful information. I am of the opinion that you never need to look at a histogram when you make sure that you do not have completely black (and even then) or completely blown-out areas. And with more modern cameras, you can easily make that visible (with my models, blue means no information and completely black, and orange means no information and completely white).
Have your say
Please note: Articles older than a week can only be commented on by signed-in visitors.Would you still like to comment? sign in or create a free account.
Become a better photographer every week
A practical photography tip in your inbox every week.
39,079 photography enthusiasts already receive the tips! More about the weekly mail. Or keep up to date via  Facebook.

Elja Trum
Photofacts; everything to do with photography!
Would you like to take better photos and keep up with what is happening in photography? Photofacts publishes articles that teach you something about photography — from a product announcement to a practical shooting tip or a look at a website. Photofacts covers photography every day and is a hobby project of Elja Trum's that got out of hand. The articles are written by a team of volunteer authors. If you would enjoy writing one or more articles for Photofacts, do get in touch.More about PhotofactsPhotofacts is made possible in part by
